

NOAA’s National Hurricane Center recently shared updated forecast cone graphics for the 2026 hurricane season. The changes could help individuals better understand wind warnings, while reminding the public that hazards often extend well beyond the cone, including inland areas.
Changes to the NHC Forecast Cone
NOAA announced the changes on March 24 as part of its 2026 hurricane season product updates.

“In 2026, the forecast cone will now include tropical storm and hurricane watches and warnings for inland areas. The additional information follows a successful experimental phase last year, which demonstrated that the improved forecast cone enabled inland communities to better understand and prepare for the danger posed by tropical cyclone winds,” according to NOAA.
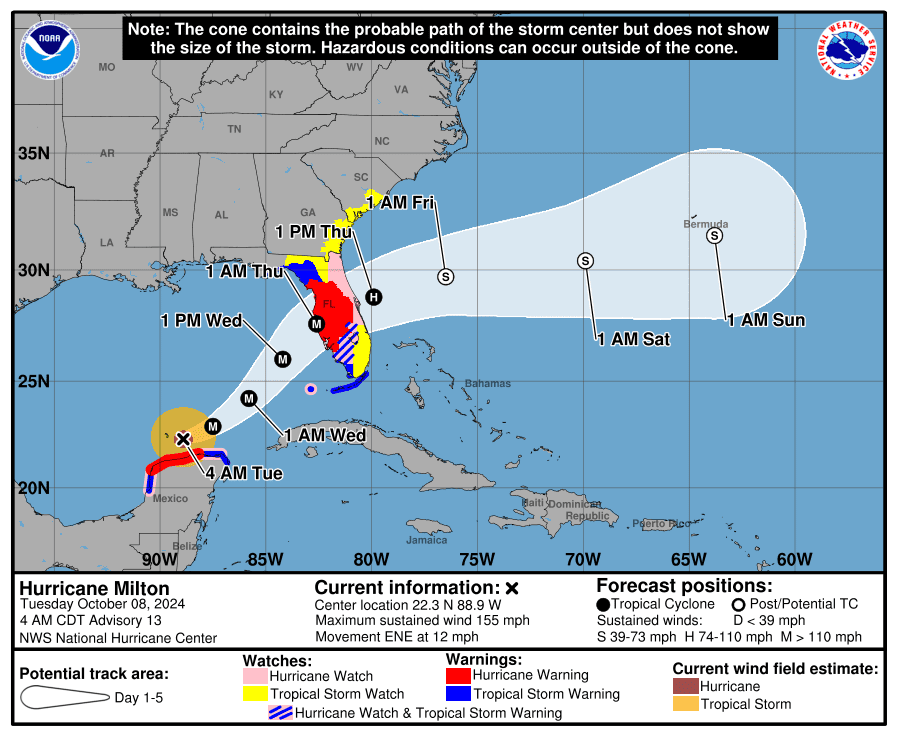
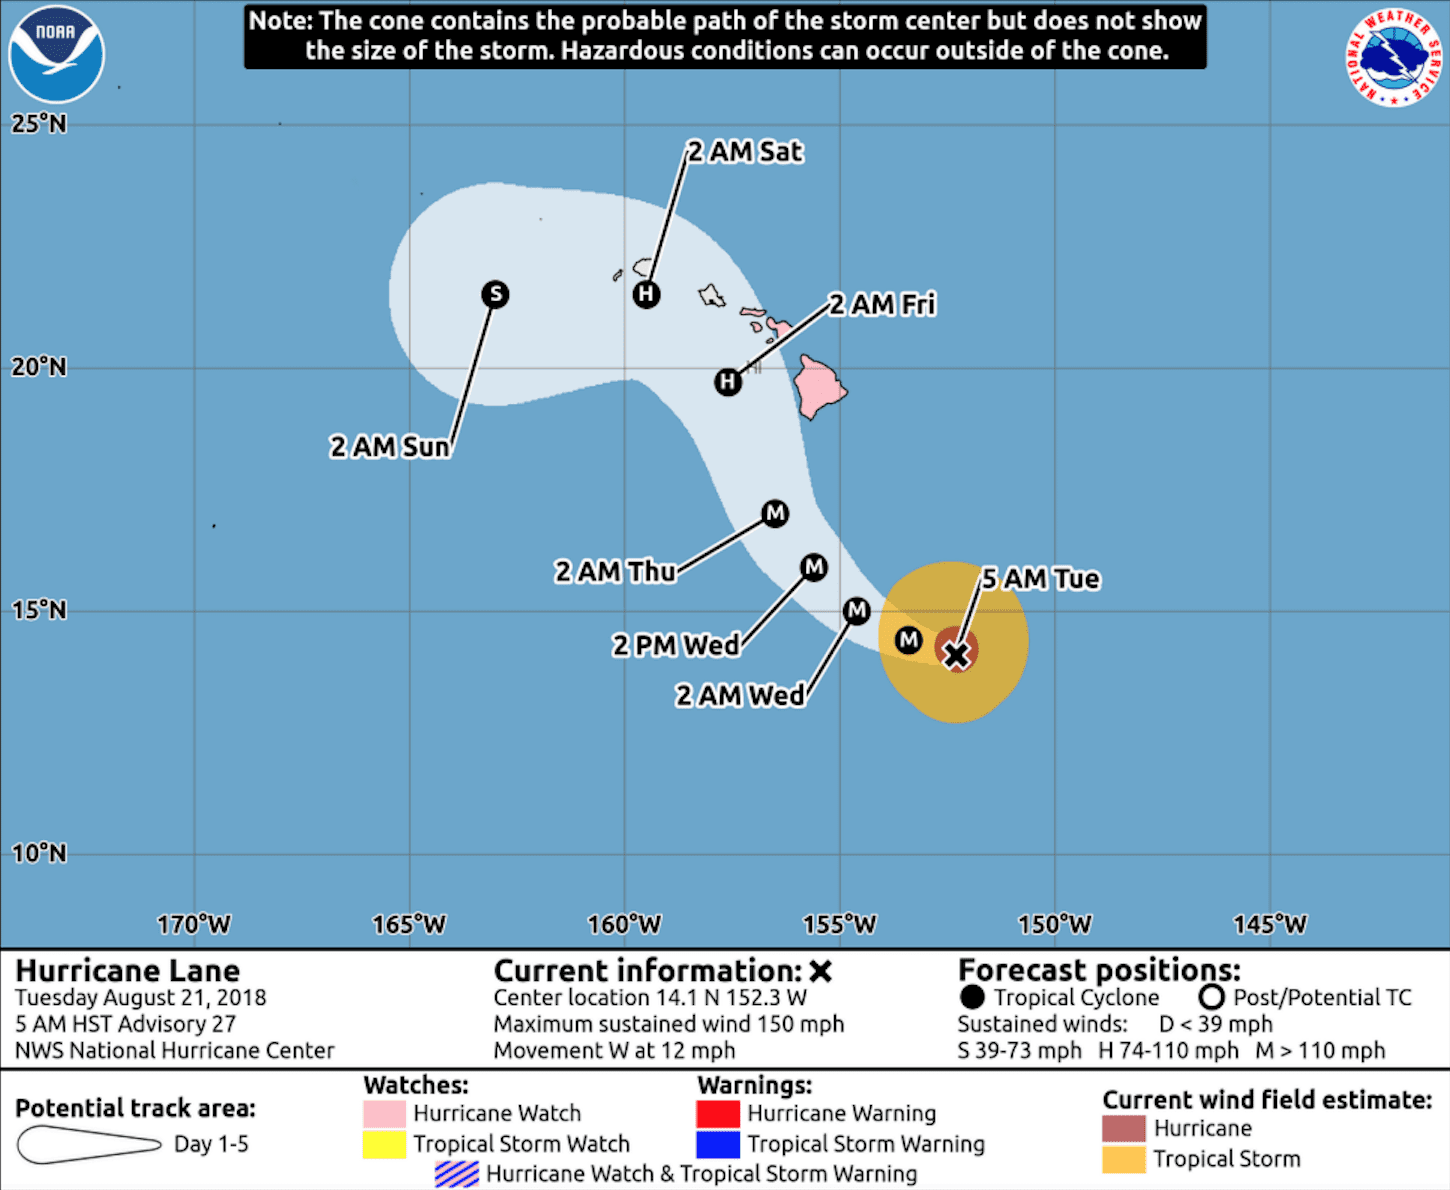
The report from NOAA explains that the new operational cone will now include all land-based tropical storm and hurricane watches and warnings in effect for the continental United States, Hawaii, Puerto Rico, and the U.S. Virgin Islands. The updated graphic will also use one shade for the full five-day cone and include a legend symbol for places where a hurricane watch and tropical storm warning are both in effect.
Hurricane Specialist’s Perspective
The Source contacted Daniel Brown, branch chief of the Hurricane Specialist Unit at the NHC in Miami, Florida, who explained the forecast product updates in further detail. For individuals in Puerto Rico and the U.S. Virgin Islands, one of the practical changes may simply be having more clarity. People will be able to see the entirety of the islands covered in a watch or warning, not only the coastal regions.
“Although in the past it appeared that the island of Puerto Rico and the U.S. Virgin Islands were completely covered when it was under a watch or warning, the original cone graphics only depicted the coastal areas under the tropical storm or hurricane watch or warning,” Brown said.
“The new operational cone graphic will completely shade all of Puerto Rico, the U.S. Virgin Islands, and coastal and inland areas in the United States when a watch or warning is in effect,” Brown continued.
“This should help residents who live in areas away from the coast to better understand that they are under a tropical storm or hurricane watch or warning and will enable inland communities to prepare for the danger posed by tropical cyclone winds,” he added.
The change to the cone this year follows an experimental phase in 2024 and 2025. In its 2026 products update, the NHC said feedback strongly supported adding inland watches and warnings, and social science research suggested the added information helps communicate wind risk without overcomplicating the graphic.
Brown said the improvements are also meant to correct one of the public’s most common misunderstandings about the cone.
“Users have often misinterpreted the cone as the area of potential impacts,” he acknowledged. “However, the cone does not provide any information on potential impacts from storm surge, wind, flooding, rainfall, or tornadoes. Instead, it depicts where the center of a tropical storm or hurricane could track. Adding inland watches and warnings takes the focus off the cone and forecast track and provides the public with risk-based information about the potential for tropical storm and hurricane-force winds through the watches and warnings.”
That message remains especially important in Puerto Rico and the U.S. Virgin Islands, where dangerous weather can affect the islands even when a storm’s center does not pass directly overhead. NOAA’s materials continue to emphasize that the cone shows the probable path of the storm center, not the size of the storm, and that hazardous conditions can occur outside the cone.
The NOAA update also said that the size of the cone will be a little smaller in 2026, about 4% to 8% smaller than in 2025, based on the latest five years of forecast errors.
A Separate Experimental Cone
In addition to the operational cone, which will be released this season, NOAA is also introducing a separate experimental cone graphic for 2026. Unlike the traditional cone, which is built around circles at each forecast point, the experimental version of the cone will use ellipses. NOAA said the new approach is meant to better capture uncertainty in both the speed and direction of a storm’s forecast path, and the experimental cone will include 90% of forecast track possibilities instead of the traditional 67% forecast error.
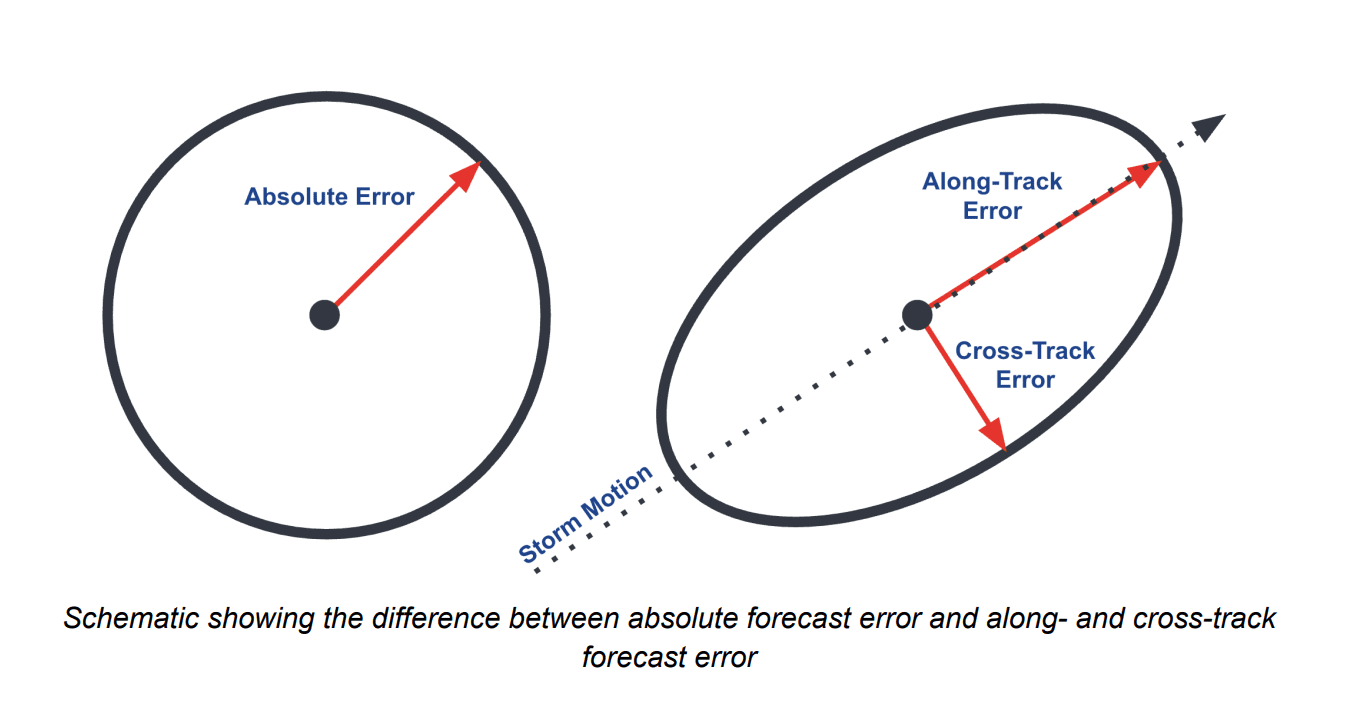
“The experimental cone will use ellipses anchored at each NHC forecast point, allowing for the experimental cone to capture a range of possibilities for both the speed and direction of the tropical cyclone’s forecast path,” Brown stated. “Since the new experimental cone will include 90% of forecast track possibilities, the cone can now be described as the likely path of the storm, because the center is unlikely to move out of the cone.”
“The ellipses used to draw the experimental cone look at NHC’s historical track errors as how far left or right the forecast was from the verifying positions of the storm and how fast or slow the forecast of the storm was,” Brown explained.
Brown also reminded readers that both the operational cone and the experimental cone are not an all-in-one hazard map.
“The experimental cone should provide the public with a better understanding of the likely path of the storm, but they should also understand that neither the operational cone nor the experimental cone provides information about all possible hazards,” he cautioned.
Other Product Updates
While the cone changes may be one of the most helpful updates for Caribbean residents, NOAA’s 2026 package includes other updates as well. The NOAA press release announced new storm surge watches and warnings, a peak storm surge graphic, and a potential storm surge flooding map for Hawaii, expanding services already used for Puerto Rico, the U.S. Virgin Islands, the Gulf, and the U.S. East Coast.
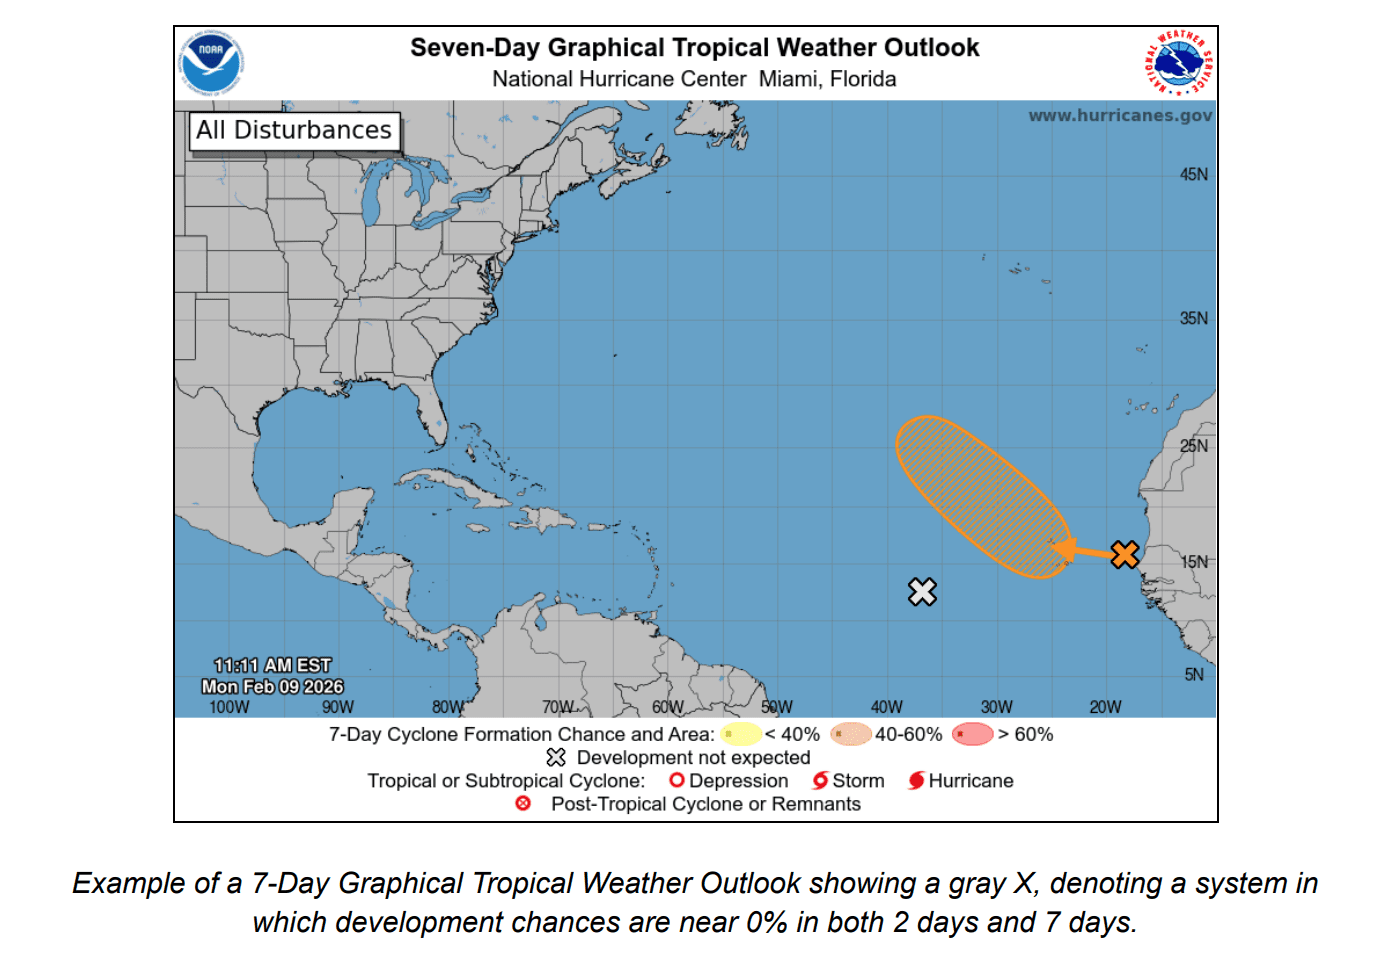
The NHC’s update also highlights an Experimental Graphical Marine Wind Warning product that covers the Caribbean Sea and other tropical ocean basins. The update includes a rip current risk map introduced in 2025 that includes Puerto Rico and the U.S. Virgin Islands when at least one tropical system is active. A change to the Graphical Tropical Weather Outlook will now show systems with near-zero development chances as a gray “X” instead of a yellow one.
Remain Prepared
Brown encouraged residents and visitors to heed the advice of the National Weather Service in San Juan, Puerto Rico, in addition to monitoring NHC cone updates. While the cone is being updated to communicate wind warnings more clearly, it is still only one part of the forecast. People in Puerto Rico and the U.S. Virgin Islands will still need to pay close attention to other official graphics, watches, warnings, and forecasts for hazards.
“The most common misconception is that the cone itself does not indicate potential impacts, although the cone graphic does communicate wind risk via watches and warnings,” stated Brown. “NHC and the local NWS office in San Juan provide other text and graphical products that provide information on other hazards associated with a tropical cyclone, such as storm surge, rainfall, and rip currents.”
“The best advice is to pay attention to watches and warnings for storm surge, wind, and rainfall hazards. Understand the risk posed by each of those hazards and have a hurricane plan to keep you and your family safe. Individuals can always find the latest forecast on the NHC’s official website,” Brown concluded.
Local Weather Information
The Atlantic hurricane season runs from June 1 through Nov. 30, but severe weather preparedness is a year-round practice in the Virgin Islands. Residents can see the local weather forecast for the U.S. Virgin Islands which is regularly updated on the Source Weather Page. Individuals can also find helpful weather information, emergency preparedness, and alerts from the Virgin Islands Territorial Emergency Management Agency.


